Scatterplots
You know the ones, dots on a plane.
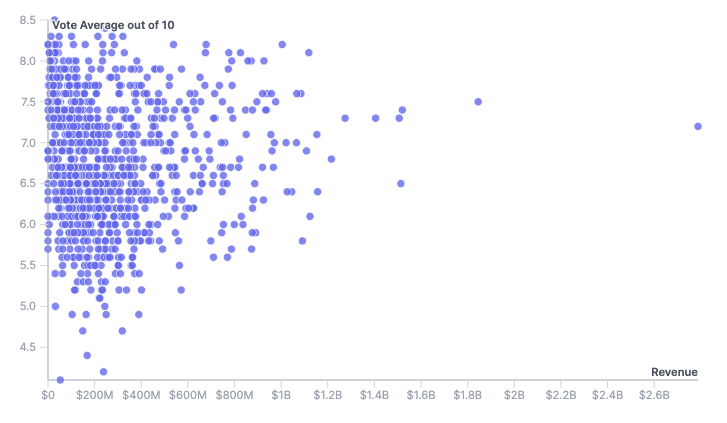
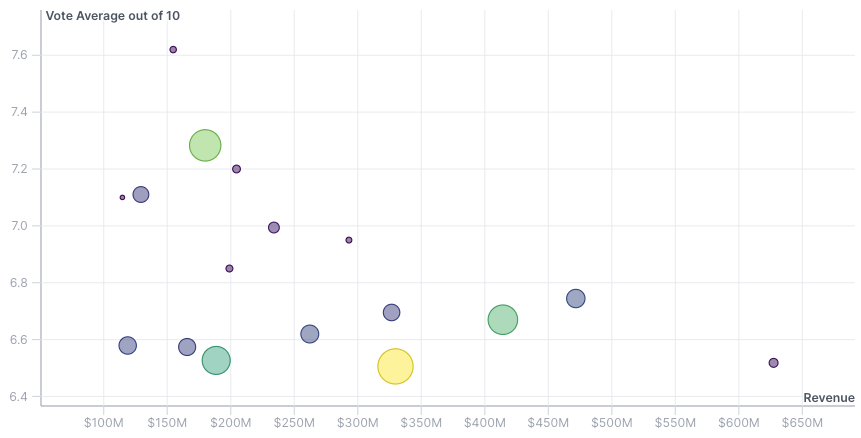
Basic Scatterplot
Just the basics of drawing a scatterplot with React and D3.
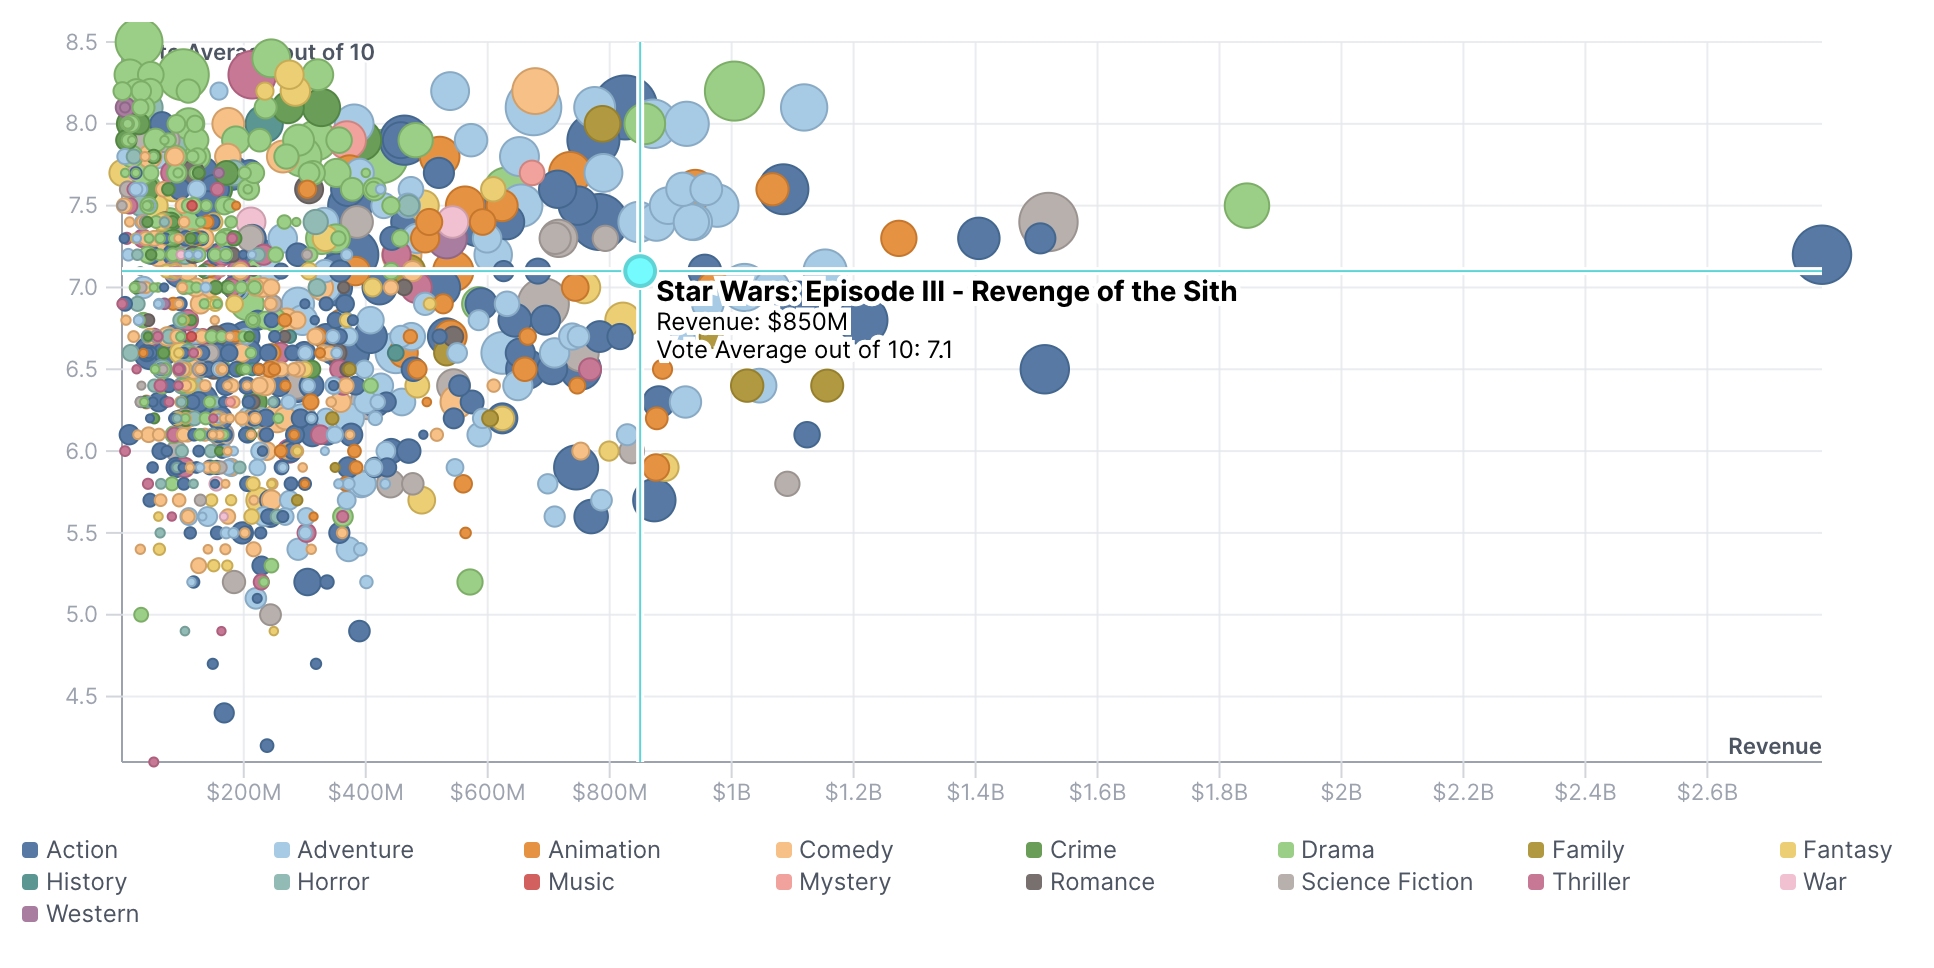
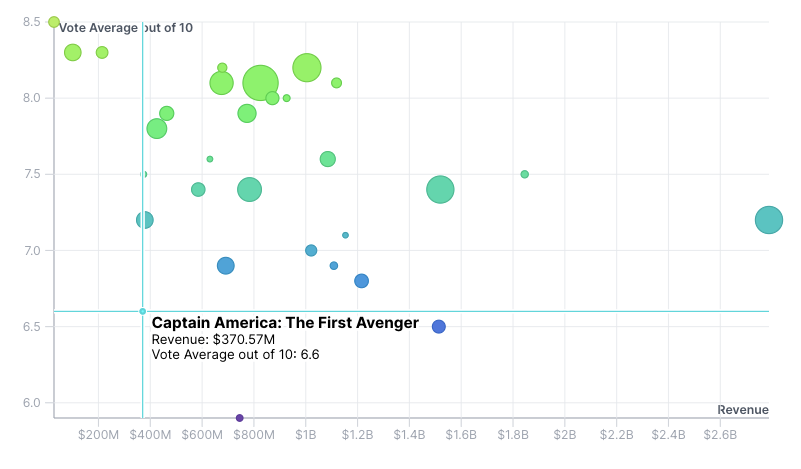
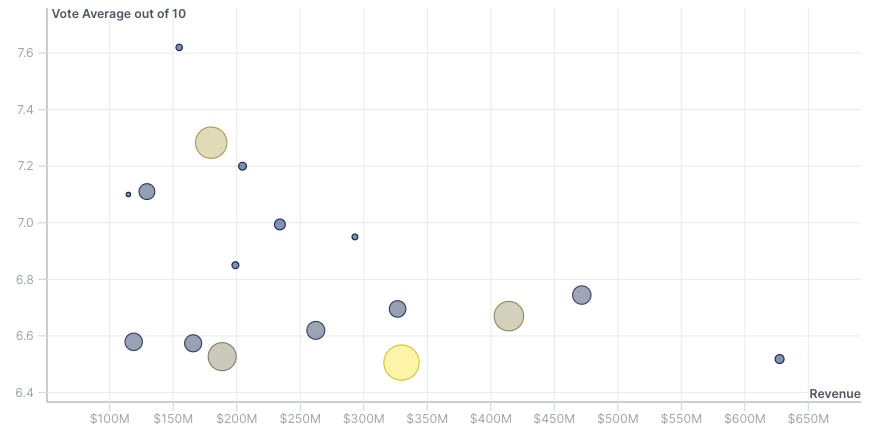
Basic SVG Hover
A scatterplot where we can interact by mousing directly over a point in the SVG.
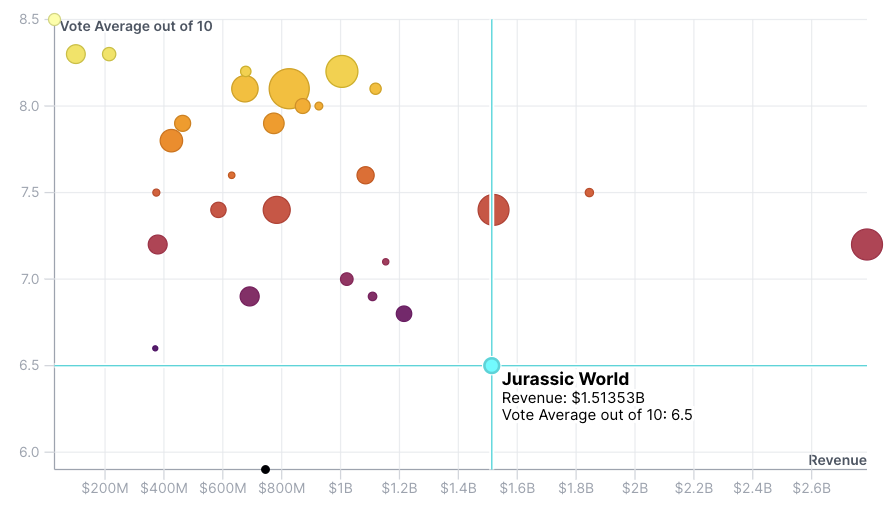
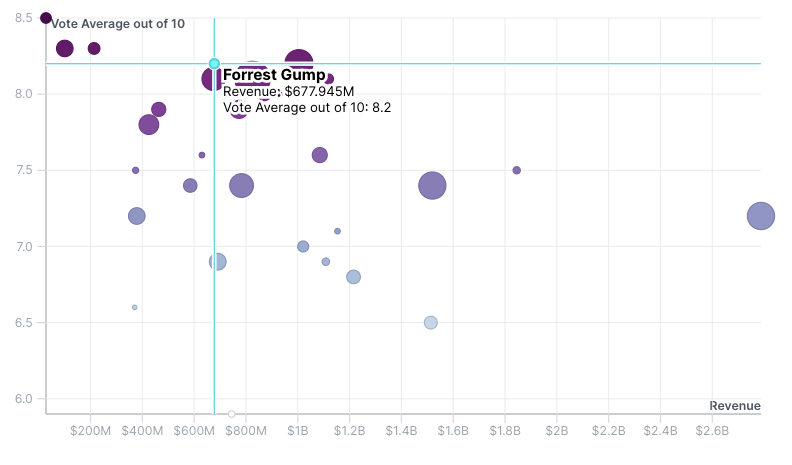
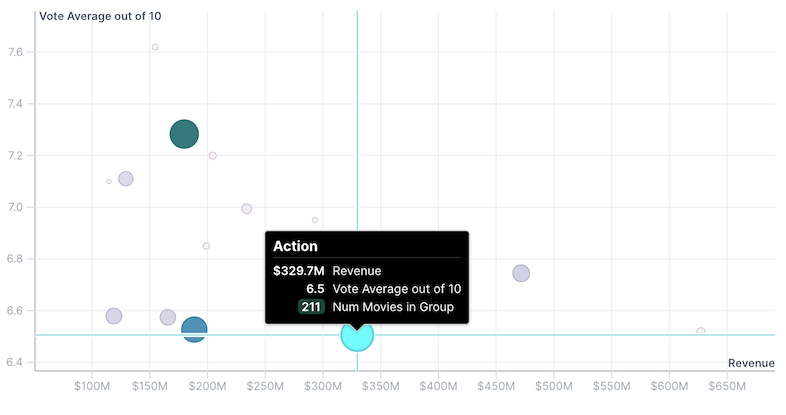
Closest Point Hover
A scatterplot where we search through all points to find points near the mouse.
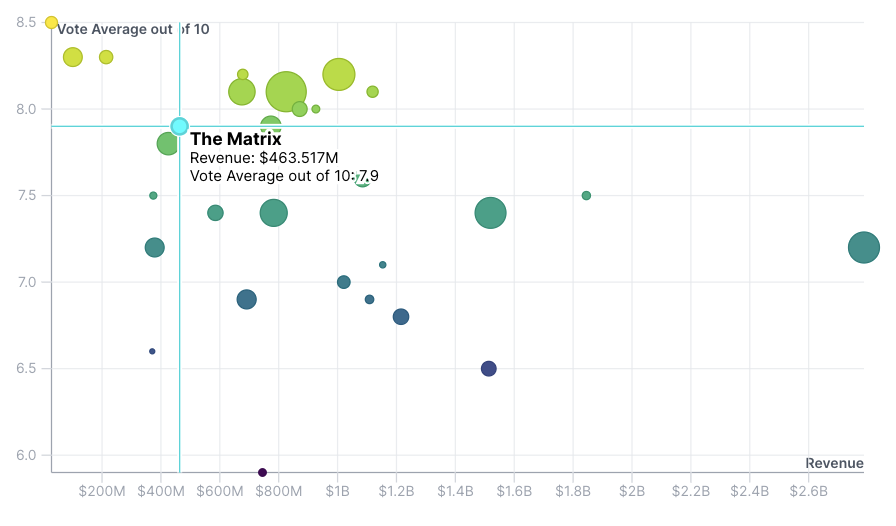
Delaunay Hover
A scatterplot where we use a Delaunay triangulation to find points near the mouse.
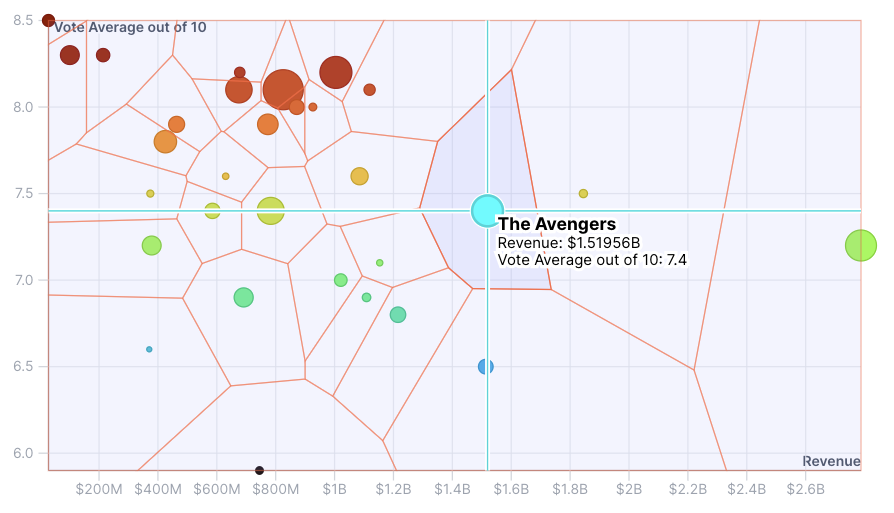
Voronoi SVG Hover
A scatterplot where we use an SVG voronoi diagram to find points near the mouse.
Quadtree Hover
A scatterplot where we use a quadtree to find points near the mouse.
KDBush Hover
A scatterplot where we use a kdbush to find points near the mouse.
Responsive via AutoSizer
A scatterplot that auto sizes to fit its container via react-virtualized AutoSizer.
Responsive withAutoSizer HOC
A scatterplot that auto sizes to fit its container via react-virtualized AutoSizer wrapped in a higher-order component (HOC).
Responsive via ResizeObserver
A scatterplot that auto sizes to fit its container via a ResizeObserver.
Tooltips via Popper
A scatterplot where we handle all tooltip positioning issues via popper.js.
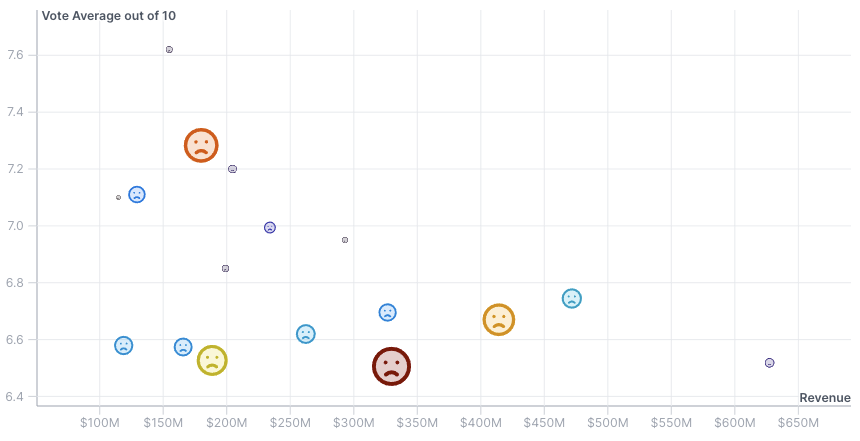
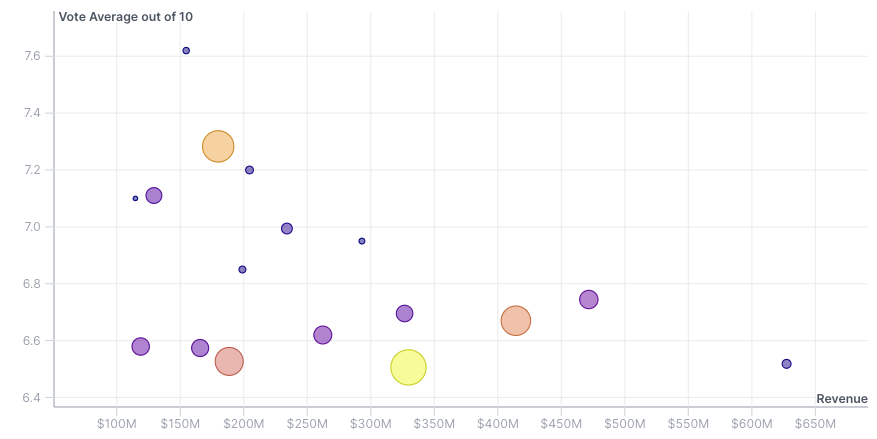
Points as symbols via `<use>`
A scatterplot that draws symbols instead of circles via SVG `<use>`.